

How many of us understand budget properly? For a layman, terms like fiscal deficit, revenue receipts, plan expenditure makes it more complex to comprehend. This article tries to understand budget in a simple manner in the light of this year’s budget.
The Union Budget of India, referred to as the Annual Financial Statement in Article 112 (Part V, Chapter II) of the Constitution of India, is the Annual Budget of the Republic of India, presented each year on the last working day of February by the Finance Minister of India in the Parliament. The budget has to be passed by both the Houses of Parliament for it comes into effect on April 1, the start of the financial year.
The budget papers tabled in the Parliament contain broadly, the budget speech, a breakdown of the detailed spending proposals of each ministry, as well as revenue raising proposals.
Understanding Budget 2013-14 Statement in terms Rs 1:
Understanding budget statement happened to be a difficult task not only to an illiterate citizen of India but also to most of the graduates. It may be due to the reason that the budget is discussed only once in a year. The common man considers it as an annual government event which certainly has some impact on the market that affects his/her daily life positively or negatively. Therefore, to make it easy the budget statement is presented in terms of Rs.1, which means the total receipts and the total expenditure of the Government of India (GOI) are assumed to be Rs.1.
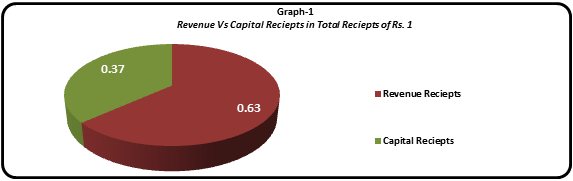
Let us now understand each of the budget accounts with the help of graphs given below. The graph-1 below reflects the share of Revenue and Capital Receipts in the Total Receipts. As per this graph, if the total Receipts of the GOI are Rs.1 then the Revenue Receipts is Rs.0.63 and the Capital Receipts is Rs.0.37.
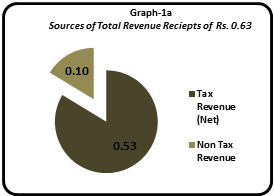
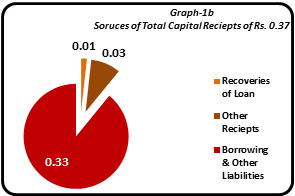
The graph-1a and graph-1b reflect the various sources and the amounts from each of the source the GOI is going to receive on account of both Revenue and Capital receipts. In the graph-1a, the major sources of revenue for total Revenue Receipts are Tax and Non tax revenues. It is clearly shown in the graph that out of Total Revenue Receipts of Rs.0.63 the GOI is going to receive Rs.0.53 from Tax Revenue and Rs.0.10 from Non Tax revenue. Similarly, in the graph-1b the major sources of revenue for total Capital Receipts are Borrowings, Recoveries of loan and other receipts. It is shown in the graph that out of Total Capital Receipts of Rs.0.37, the GOI is going to receive Rs.0.33 from Borrowings, Rs.0.01 from Recoveries of loan and Rs.0.03 from other receipts.
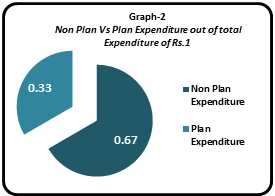
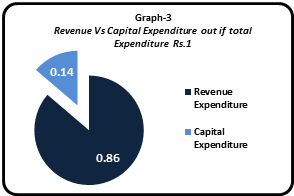
The graph-2 above reflects the share of Non Plan and Plan expenditure in total budgeted expenditure. As per the graph if the total Expenditure of GOI is Rs.1 then the share of Non Plan Expenditure is Rs.0.67 whereas the share of Plan Expenditure is Rs.0.33. Similarly, if the total Expenditure is seen from the Revenue and Capital Expenditure point of view then as per the graph-3 the Revenue Expenditure is Rs.0.86 whereas the Capital Expenditure is Rs.0.14.
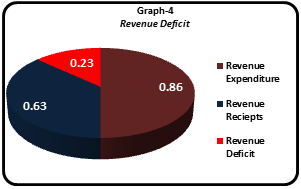
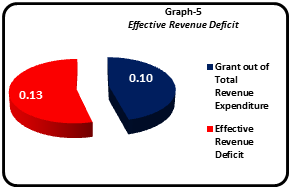
The graphs number 4 – 7 above reflects the deficit budget. The graph-4 shows that the Revenue Expenditure exceeds the Revenue Receipts by Rs.0.23 which is known as Revenue Deficit. And the graph-5 shows that if the amount which is paid as the grant for capital or asset creation from the total revenue receipts is deducted then the resulting value will be referred as the effective revenue deficit. As per the graph the grant for capital or asset creation is Rs.0.10, therefore the primary deficit would be 0.13.
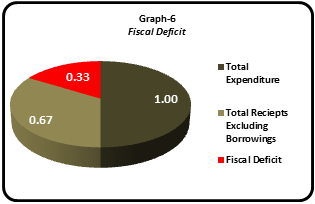
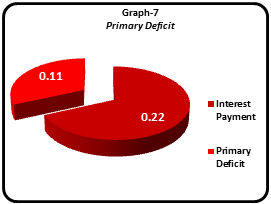
Similarly, the graph-6 shows that the total Expenditure exceeds the total Receipts (minus borrowings) by Rs.0.33, which is known as Fiscal Deficit. Whereas the graph-7 shows that if the amount which is paid towards the interest payment is deducted from the fiscal deficit then the resulted value will be referred as the primary deficit. As per the graph the interest payment is Rs.0.22 therefore the primary deficit would be 0.11.
Interpretations:
From the above illustrations it can be understood that the Revenue Receipts, which is 63% of the total receipts, is the major source of revenue for GOI. In addition, around 84% of the total Revenue Receipts are generated from the Tax Revenue and borrowing around 16% from Non Tax Revenues. The share of Capital receipts in Total Receipts is less than the Revenue Receipts and around 89% of the total Capital Receipts are generated through Borrowings. The budget statement also reflects that the GOI is facing the Revenue deficit of about 36% of the total Revenue Receipts and the fiscal deficit of nearly 49% of the total Receipts (minus borrowings). This information shows that if the total Expenditure of GOI is Rs.1 then to balance its total receipts with total expenditure the GOI need to borrow Rs.0.33.
Impacts of Budget:
After going through the major allocations announced let us know what could be the impact of the budget on the goods and services as well as on citizens particularly the middle class.
a) On goods and services:
| What goes up | What goes down |
| Cigarettes, Cigars, Mobile phones, Imported luxury cars, High-end motor vehicles , SUVs, Marbles, Silver , Set-top boxes, Dining in air conditioned restaurants, Marbles , Silver, Set-top boxes, Dining in air conditioned restaurants | Jewellery, Cotton garments , Agricultural testing procedures , Ships and vessels, Cinema and films, Machinery for manufacturing of leather goods |
b) On Citizens particularly on Middle Class:
Though at first glance, the budget may appear harmless to the citizens particularly to the middle-class. But the in-detail analysis reveals something else. The proposal to impose service tax on all air-conditioned restaurants would make eating out expensive by at least 12%. So people need to pay more if they want to eat in AC restaurants. The proposal to increase in excise duty to 6% from 1% on smart phones (or phones that cost more than Rs.2, 000) would result in people paying more to talk. As we are aware that as per law the metro cities should have digitised cable connections and the users are required to install set up boxes. But the proposed increased (to 10%) in the import duty on set-top boxes makes them costlier and results in people paying more to watch television. A similar impact shall be there on the travelling due to the fuel price hike.
Budgets and the Education Sector
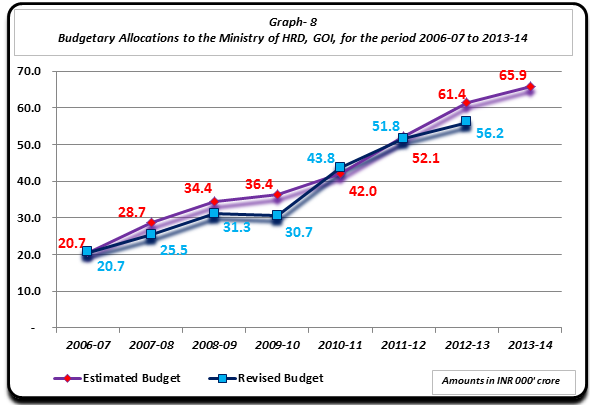
Education and the human resource development come under the Ministry of HRD GOI. Let us see what the quick analysis says about the focus of national government on education sector. The MoF has allocated Rs. 65,869 crore to the Ministry of HRD. This announcement may have pleased the student community. But a close look into last few budgets reflects something else.
|
Table-1 Budgetary Allocations to the Ministry of HRD for the period 2006-07 to 2013-14 |
||
|
Amounts in INR 000′ Crore |
||
|
Year |
Estimated Budget |
Revised Budget |
| 2006-07 | 20.7 | 20.7 |
| 2007-08 | 28.7 | 25.5 |
| 2008-09 | 34.4 | 31.3 |
| 2009-10 | 36.4 | 30.7 |
| 2010-11 | 42.0 | 43.8 |
| 2011-12 | 52.1 | 51.8 |
| 2012-13 | 61.4 | 56.2 |
| 2013-14 | 65.9 | |
(Source: Ministry of Finance, GOI)
The table-1 above, the budgetary allocations announced to Ministry of HRD to be spent on primary, secondary and higher education since 2006-07 to the 2013-14. A vertical flow of the figures and amounts in the second column of the table, ‘Estimated Budget’, shows a continuous increase in the funds allocated every year to the education sector. But the second column, ‘Revised Budget’ horizontally shows the variation in the estimated budget and revised budget allocation. Every year, except the year 2010-11, the budgetary allocations for the Ministry of HRD have been revised downward. The same trend has been reflected in the graph-8 below.
It is to be noted that in the year 1966, the Kothari commission gave recommendations that the expenditure on education sector should be 6 % of GDP. If the present allocated fund is seen from this point then the budgetary allocation for education sector stands around 3.36 %. As education is one of the key sector that contribute to Human Development, hence, the student community of India expects the FM to come up with more funds at least equal to the 6% GDP recommended by the Kothari commission. Obliviously, the increased in expenditure on the education sector shall not only be appreciable but also will be praise worthy and contributes to the national development.
Conclusion:
Following a brief note on the Union Budget 2013-14, at the conclusion it can be said that the FM could have done more particularly to the education sector, agricultural sector manufacturing sectors, women & family welfare, minorities and youth (employment).
In spite of all the proposals made and the allocations announced, under the dark clouds of scams engulfing India every day, the best execution and effective utilization of allocated funds, however, remains a great challenge for the GOI. In addition, the huge fiscal deficit and high rate of inflation remains the other challenges. Ahead of the 2014 election, it seems to be a right time for the central government to prove itself on how effectively it can execute and utilize the allocated funds for the development of the Indian citizens and how strategically it can regain its potential annual economic growth of 8%.
——————————————————————————————————————
|
Basic concepts and terminologies that appear in a budget statement |
| Revenue Receipts: Revenue receipts are the revenues estimated to be received by the Government from the tax and non tax sources. |
| Capital Receipts: Capital receipts are the government loans raised from the public, government borrowings from the Reserve Bank and treasury bills, loans received from foreign bodies and governments, divestment of equity holding in public sector enterprises, securities against small savings, state provident funds, and special deposits. |
| Plan Expenditure: Expenditure on schemes and projects covered by the Five-Year Plans. Such plans are developed by the Planning Commission after consulting individual ministries. Each Plan specifies programmes that ministries will fund and develop over the next five years. Plan expenditure can have both revenue and capital components. |
| Non-Plan Expenditure: Ongoing expenditure by the government not covered by the Plans. These include interest payments on government debt, expenditure on organs of the state such as the judiciary and the police and even expenditure on the maintenance of existing government establishments such as schools and hospitals. Non-plan expenditure too, has revenue and capital components. |
| Revenue Expenditure: Expenditure not used to create assets e.g. expenses on salaries or other administrative costs. It is a regular expenditure who effect will remain for short term not more than one year. |
| Capital Expenditure: Expenditure used to create assets or to reduce liabilities. It is an expenditure that will have its effects in long term normally more than one year. |
| Revenue Deficit: The difference between revenue receipts and revenue expenditure. |
| Effective Revenue Deficit: Revenue Deficit minus grants for capital or asset formation from Revenue Expenditure. |
| Fiscal Deficit: The excess of the total expenditure over the total receipts (excluding borrowings). |
| Primary Deficit: Fiscal Deficit minus interest payment. |

assalam. first of all, the site looks good.
and then on the article. good one explaining things of the national fiscal to this laymen in simple terms.
but the comments on the education sector budget allocation seemed too negative. even though the revised budget was less than the estimated one almost every year, the revised seen alone will give you a positive impression. the revised budget is showing that more or less the budget has got a positive slope in terms of amount allocated.
the ‘six percent’ was only a recommendation by a committee, not an obligation by the constitution. obcviously i too would have been among the excited ones had it been SIX percent as i too plan to live on the stipends by the govt a few more years :p
Good job and an accurate analysis of the budget and its components, and i wish the government can make a good use of its money towards education sector, agricultural sector manufacturing sectors, women & family welfare, minorities and youth (employment) as the writer suggests
First of all I want to say great blog! I had a quick question that I’d like to ask if you don’t mind.
I was interested to know how you center yourself and
clear your thoughts before writing. I have had a hard time clearing my
mind in getting my thoughts out. I do take pleasure in writing but it just seems like
the first 10 to 15 minutes are generally wasted just trying
to figure out how to begin. Any ideas or hints? Appreciate it!